
See this blog post about the errors
Thankfully, due to print-on-demand technology, these initial errors were corrected quickly. Even though the book went through multiple proofreading passes by professionals, small defects still get through. My apologies.
The items below have been fixed. Some additional errors have been corrected over time.
Front cover: The blue lines around “OF” were misaligned vertically in the very first printings.
Back cover: “the Lean” should have said “the Lean methodology” and has just been removed from future printings.
Page 67: The chart is monthly data, but was incorrectly labeled “weekly.”
Page 81: The next to last bullet point has an extra “a” – “a new a system” should read “a new system”
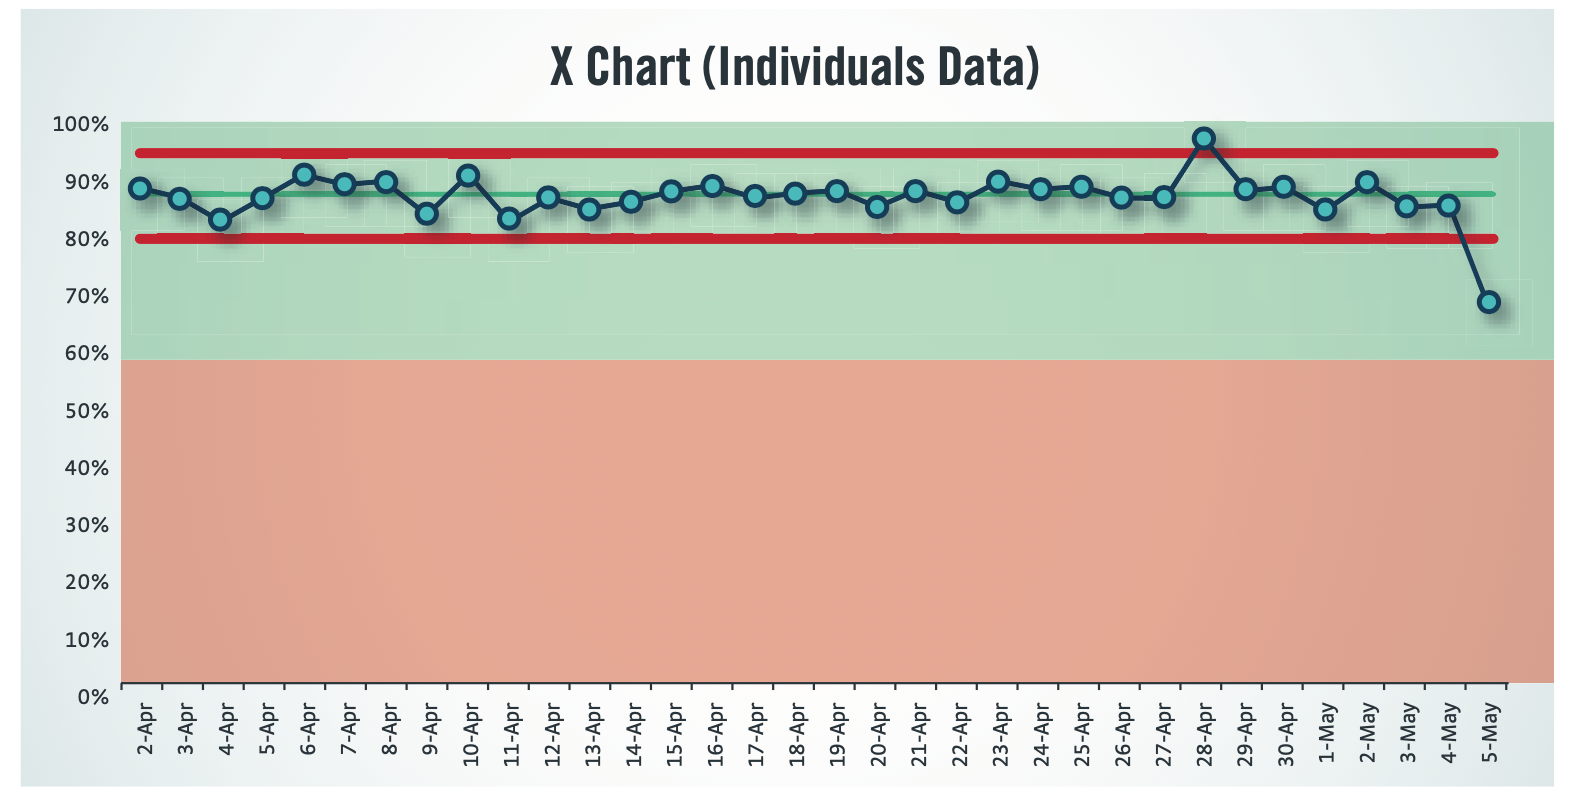
Page 99: The boundary of the red and green shading was incorrect. The chart should roughly look like this (and will look nicer when formally corrected). That last data point is supposed to be in the green zone still, as the text says.
The figure should look like this:
Page 124: Typo of “Softwar-development”
Page 156: The X-axis labels are not aligned well with the data points
Page 157: The chart has an extra data point.
Page 157: The x-axis dates are incorrect and should be the same as the chart on Page 156.
The charts on Pages 156 and 157 should look like the following and will be corrected in future printings.
Page 157: The last paragraph mentions September 2008 and asking “Why was the metric so good that month?” — but should refer to October 2008.
Page 170: On the chart, the orange legend text says “Dec 2010 – Nov 2010” (should be Nov 2011).
Page 184: Last paragraph says “April 2018” when it should read “April 2016.”
Page 181: The dashed line on the chart should be at 44, but appears to be more like 41.
Page 194: Typo of “ssafe-driving”
Page 220: What says “mostly likely” should read “most likely”
Appendix A: A more clear explanation of when to manually set limits to zero or 100 is:
“There are times when we might need to manually set the Lower or Upper Limit (and Rule 3 would not apply):
- If the X Chart is a metric that cannot be negative (such as something that is counted) and the Lower Limit is calculated as a negative number, it can be set to zero.
- If the X Chart is a metric where 100% is the highest possible value (such as an on-time delivery percentage) and the Upper Limit is calculated to be more than 100%, then the Upper Limit can be set to 100%.”
Again, my apologies. These will all be corrected for future printings ASAP.
Early eBook Errata
The following are changes that have been made in the eBook since its initial publication in August 2018. The eBook has been updated for new purchasers. These errors are not in the print edition.
- The X chart for the number of Oscar telecast viewers erroneously had the years 1991, 2002, and 2013 appear twice in the X-axis. The last data point should have been labeled 2018 instead of 2017.
The chart should look like this (click for a larger view):
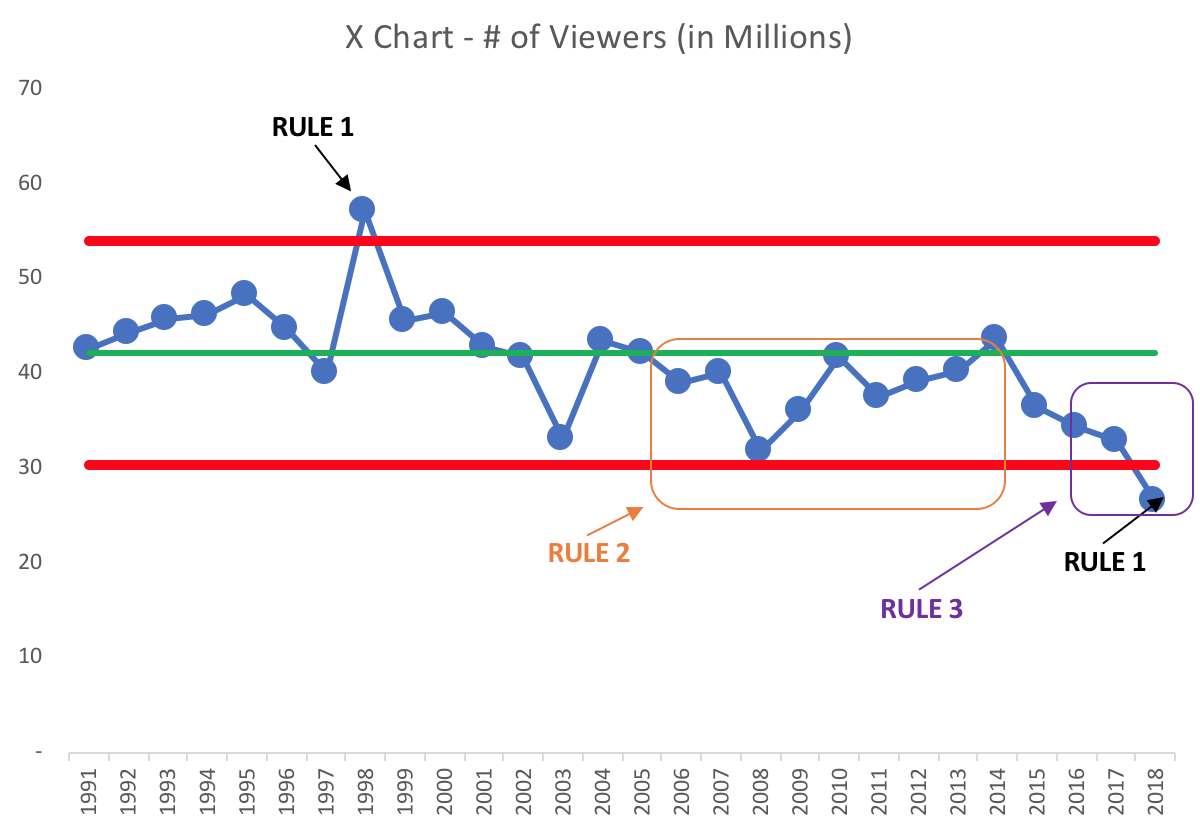
- In the discussion of the Oscars, the sentence “The data and charts show that 2008 was the lowest year in recent history by a small margin” should have said that 2018 was the lowest year.
- In the section about the surgical deaths simulation, “there were 10 deaths in Period 2″ should have said Period 4.
I apologize for any errors.