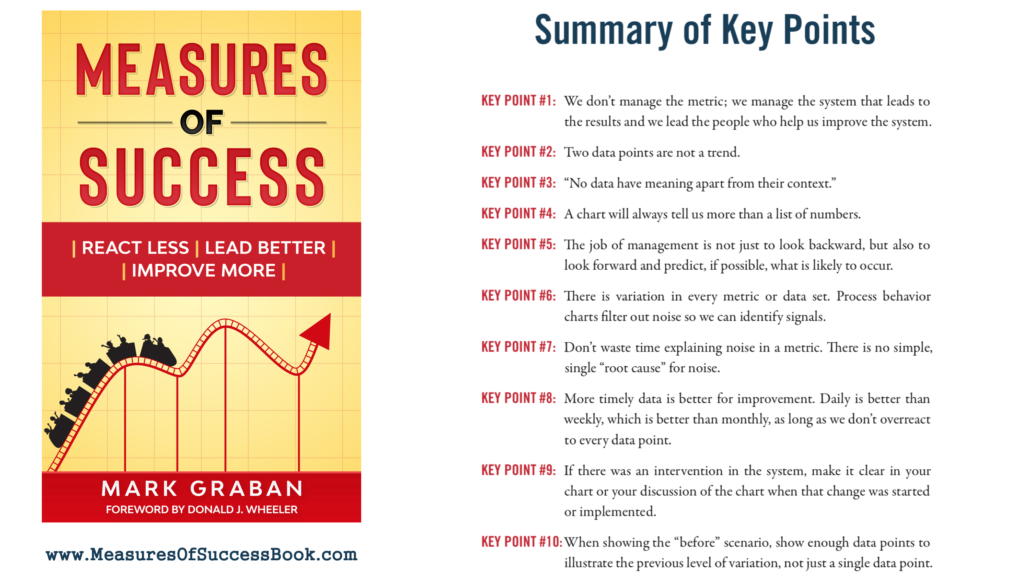
Summary of Key Points from Measures of Success
KEY POINT #1: We don’t manage the metric; we manage the system that leads to the results and we lead the people who help us improve the system.
KEY POINT #2: Two data points are not a trend.
KEY POINT #3: “No data have meaning apart from their context.”
KEY POINT #4: A chart will always tell us more than a list of numbers.
KEY POINT #5: The job of management is not just to look backward, but also to look forward and predict, if possible, what is likely to occur.
KEY POINT #6: There is variation in every metric or data set. Process Behavior Charts filter out noise so we can identify signals.
KEY POINT #7: Don’t waste time explaining noise in a metric. There is no simple, single “root cause” for noise.
KEY POINT #8: More timely data is better for improvement. Daily is better than weekly, which is better than monthly, as long as we don’t overreact to every data point.
KEY POINT #9: If there was an intervention in the system, make it clear in your chart or your discussion of the chart when that change was started or implemented.
KEY POINT #10: When showing the “before” scenario, show enough data points to illustrate the previous level of variation, not just a single data point.

