
Question from a reader:
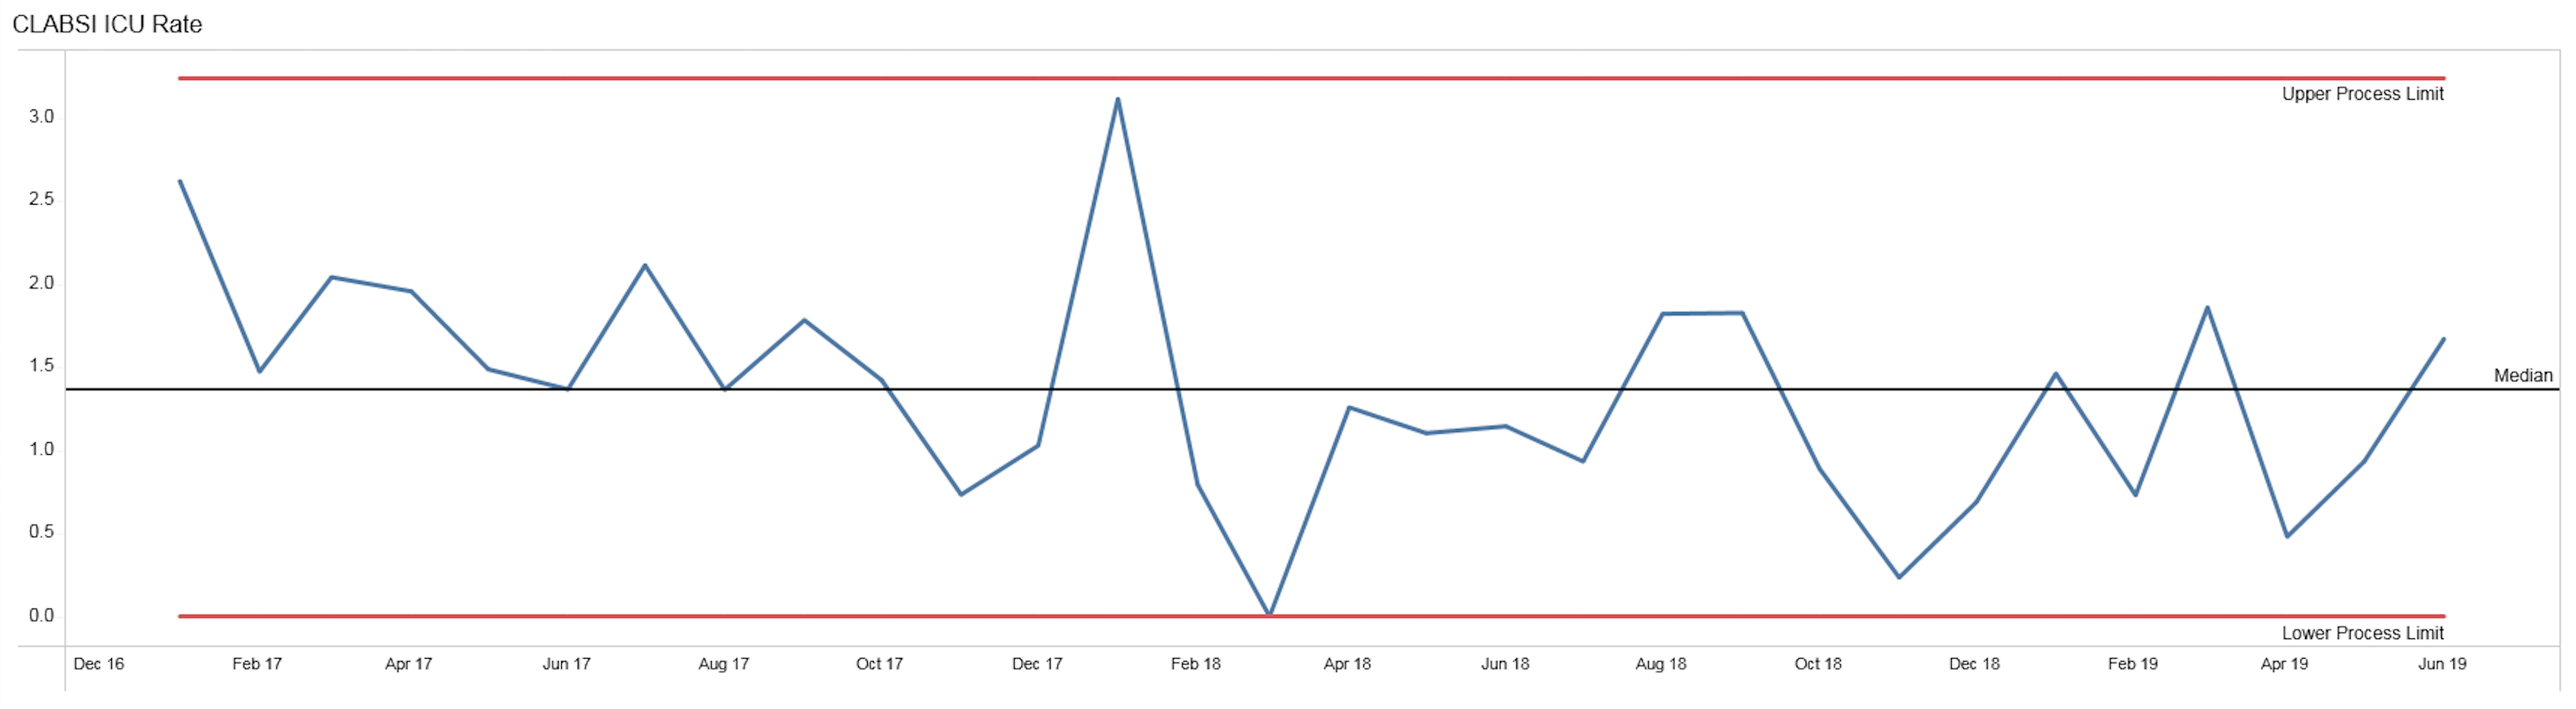
As we know sometimes when we calculate the Natural Process Limits, the Lower Limit is negative. In some measures, that’s not a practical value, like in the example below (where we set the limit to zero). Therefore we made the Lower Limit = 0.
A couple things when looking at this:
- to eye the limits don’t look symmetrical – will these create confusion for people?
- application of the rules, particularly the rules that state if it’s closer the limit than the median. With this artificial limit might we create a risk of a false signal?
Thoughts on situations like these?
Good question… it can create confusion to have asymmetrical limits… and it can cause confusion to have a negative limit for measures that can’t be negative (like infection rates, defects, falls, new customers, etc).
We have the same problem when there is an Upper Limit that’s calculated to be greater than 100% when the measure can’t be more than 100%.
I’ve done it both ways…
- manually setting the limit to zero or
- let the limit be negative and display as negative
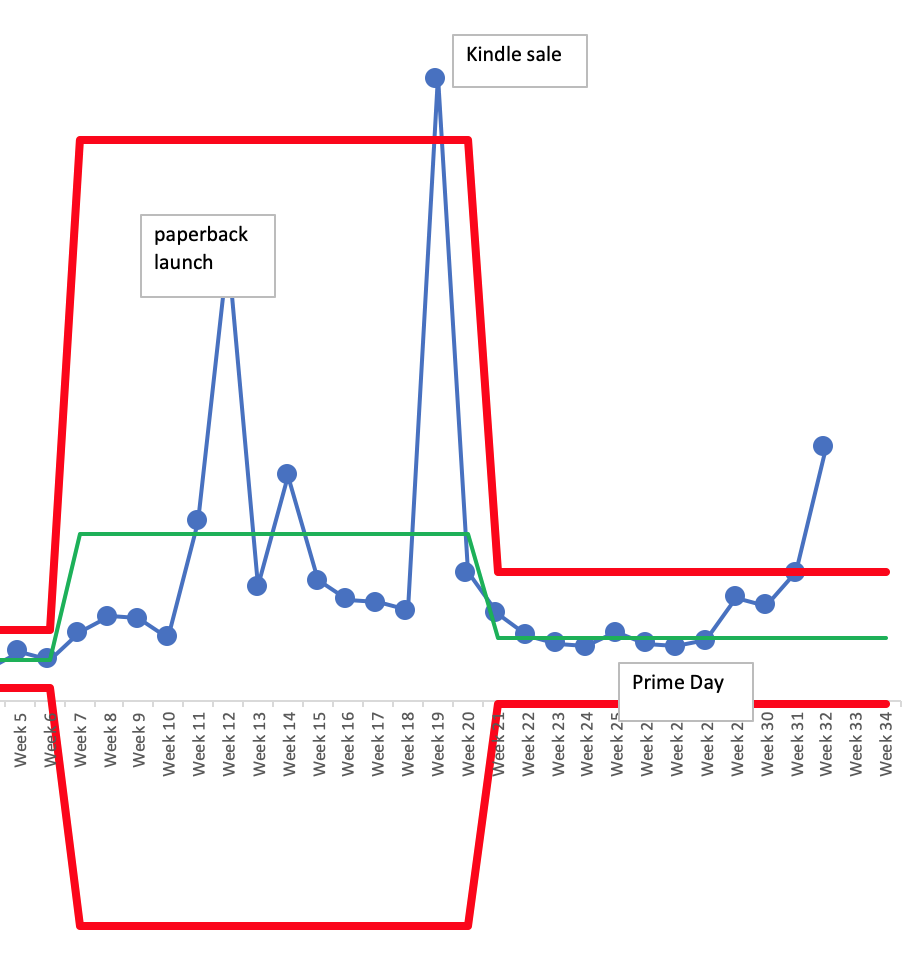
The downside of tweaking the limit that way is that you could really only rely on “Rule 2” signals, looking for eight or more consecutive data points below the average. If there’s a data point right at zero, when the Lower Limit has been set to zero, itwouldn’t be a signal).
Here is an example with a negative limit shown (a count of weekly book sales, which cannot be a negative number):
My suggestion would be to try both methods (or survey people)) to get a sense of which is least confusing in general.
Hope that helps…