
A reader asked:
“I am wondering at what point do you recommend recalculating the average and upper and lower limits?”
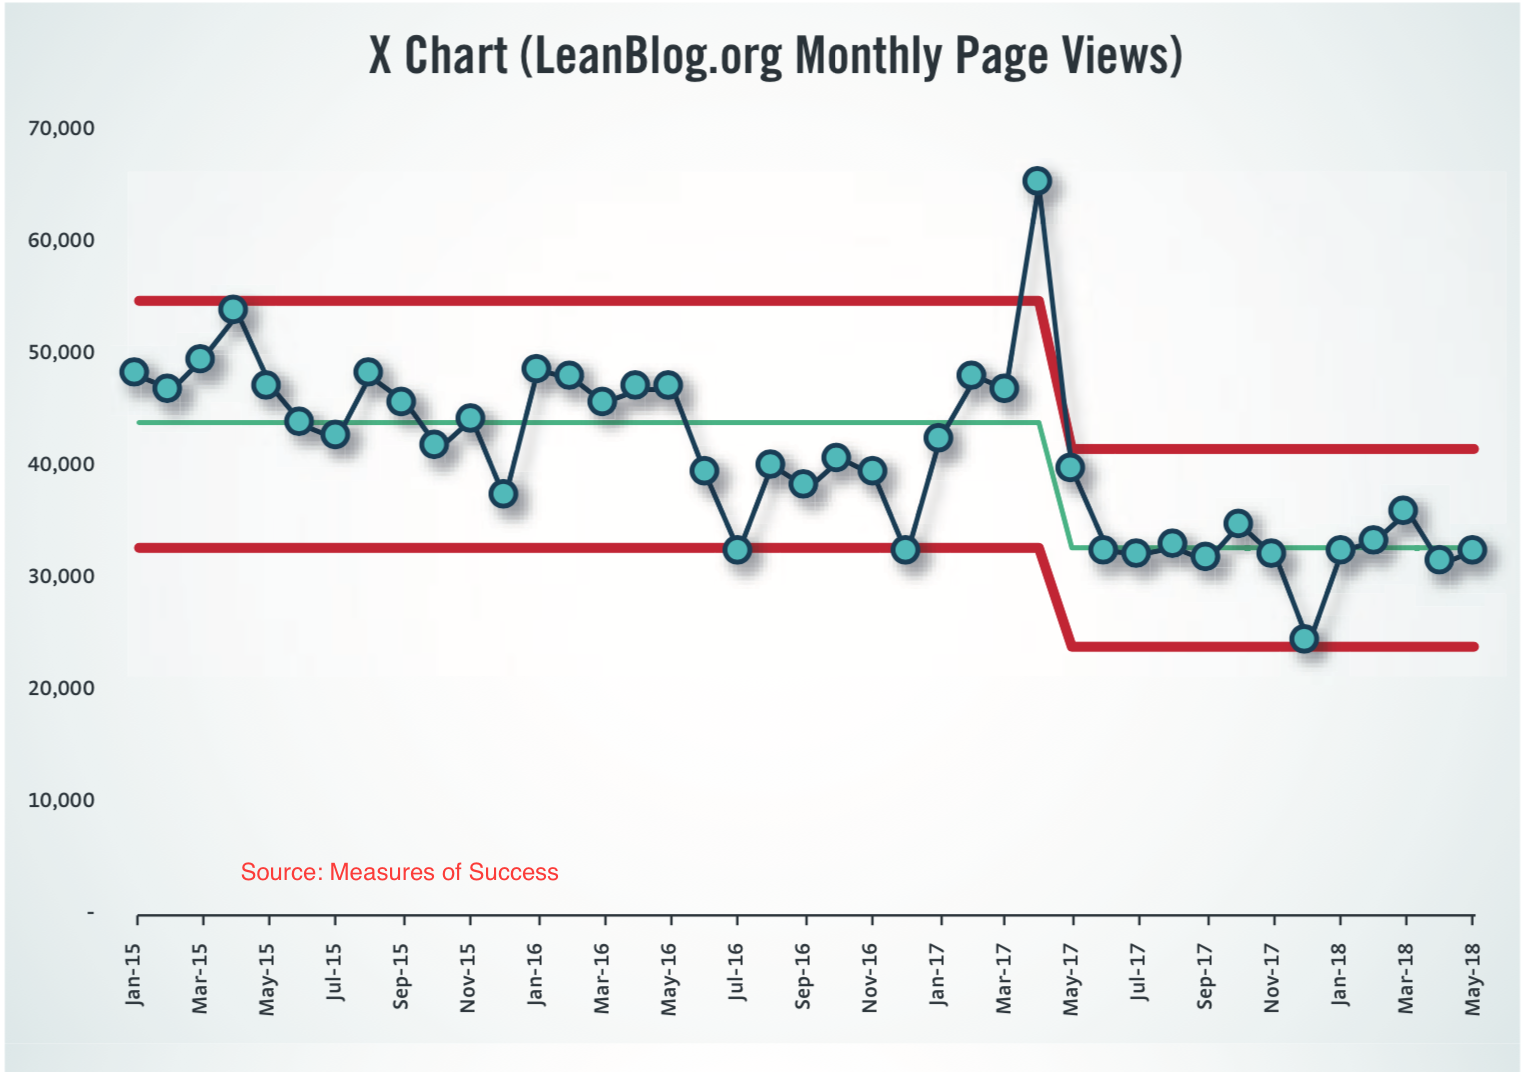
Generally, we’d recalculate limits when there’s a signal that performance has shifted to fluctuate around a new average (evidence would be the “Rule 2” signal of eight consecutive data points above or below the old baseline average), like below. I shifted the limits downward starting in May 2017, the first below-average data point in a run of eight below the baseline average.
“I work in health care and have developed Process behaviour charts for many of our processes using the last 2 years of data. Do I leave the average calculation in my excel spreadsheet based on those initial 24 points? Or adjust the formula each month as I add data?”
No, it’s not a good practice to continually recalcuate each time there’s a new data point. We should only recalculate when there’s a signal / shift in performance. The average and the limits are established from a baseline timeframe of data points. If that baseline timeframe is a predictable system (meaning we have no signals in the chart), then we use the PBC to see if that predictable system is continuing or if it has changed.