
A reader shared a Process Behavior Chart with me and asked this:
“On the Falls_Harm tab, the limits seem a bit far away from the mean.”
As I wrote back, the Lower and Upper Natural Process Limits are calculated based on the amount of point-to-point variation that exists in the metric. We use the “Average Moving Range” as an input into the formulas:
Upper or Lower Limit = Average +/- 3 * Average Moving Range / 1.128
From his spreadsheet:
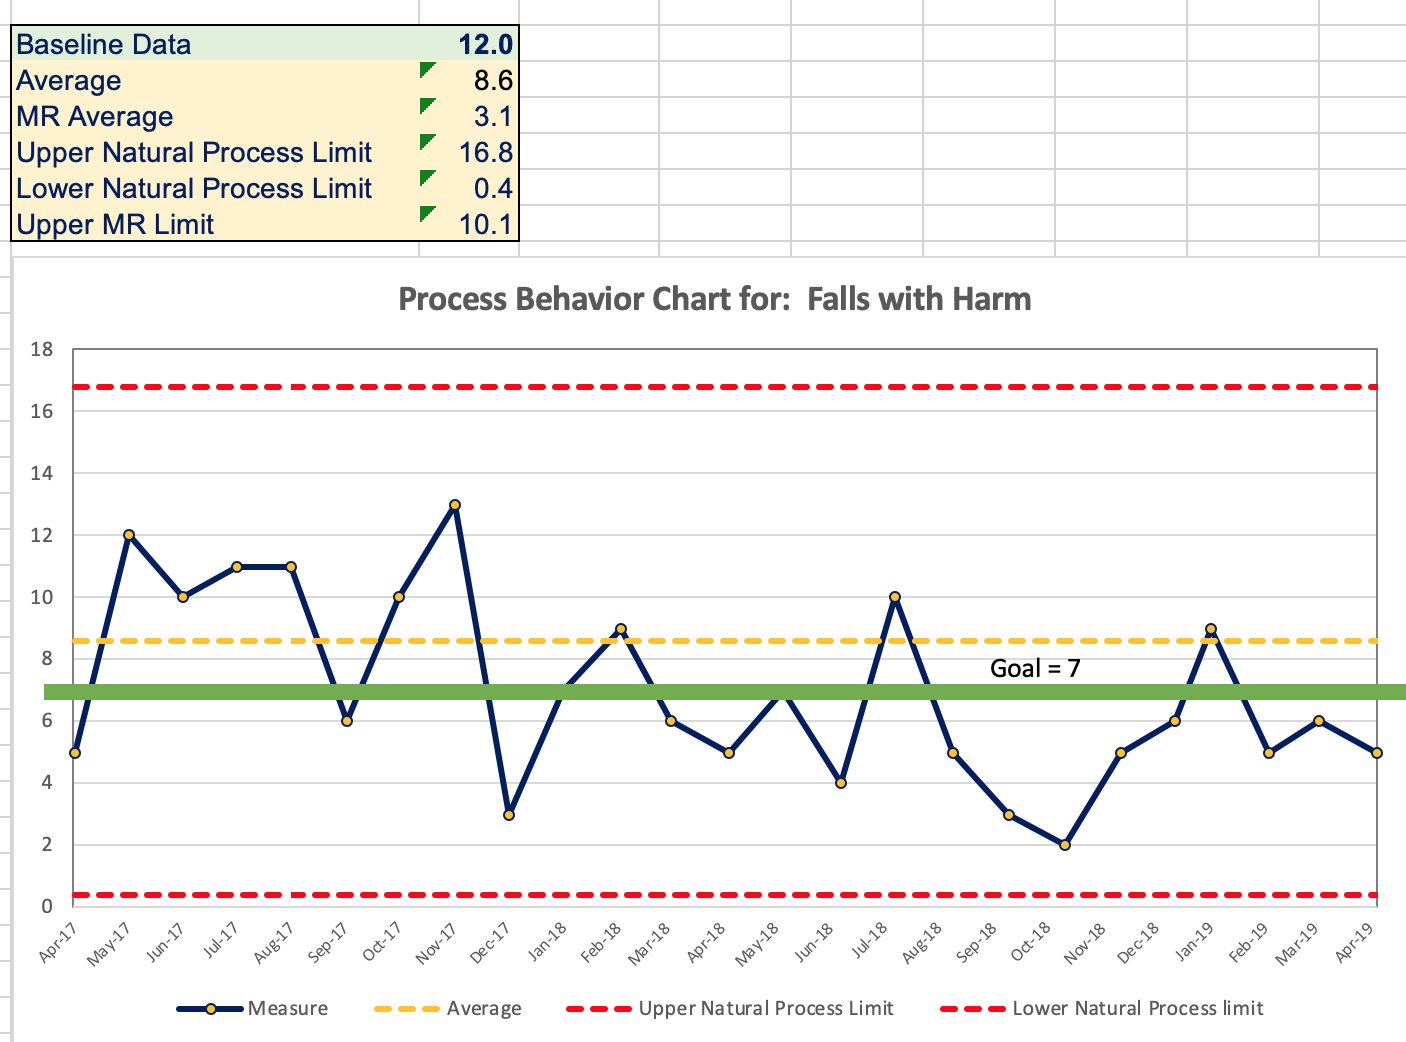
The limits “are what they are.” They are the “voice of the process,” if you will.
The PBC tells us that we have a “predictable system” that will continue fluctuating around an average of 8.6 falls per month. The lower and upper limits are 0.4 and 16.8, so we’d expect future months to fall within that range unless we can improve the system in some way.
The goal is 7 falls per month, but the PBC tells us that the system is not capable of hitting that goal each and every month. It will happen some months, but even the month of just 2 falls is not a “signal” of system improvement. It’s all random fluctuation, where a stable system is producing variable results.
We can work to improve the system in ways that:
- Reduce the average
- Reduce month-to-month variation — this would lead to narrower limits around the average
The best evidence of significant changes to the system would be:
- A month with zero falls
- Eight consecutive months with 8 falls or fewer
- 3 out of 4 (or 3 consecutive months) of 4 falls or fewer
Any of those events are very unlikely to be due to continued random fluctuation.
If I were in the reader’s shoes, I’d suggest using all 25 data points as baseline… which leads to this:
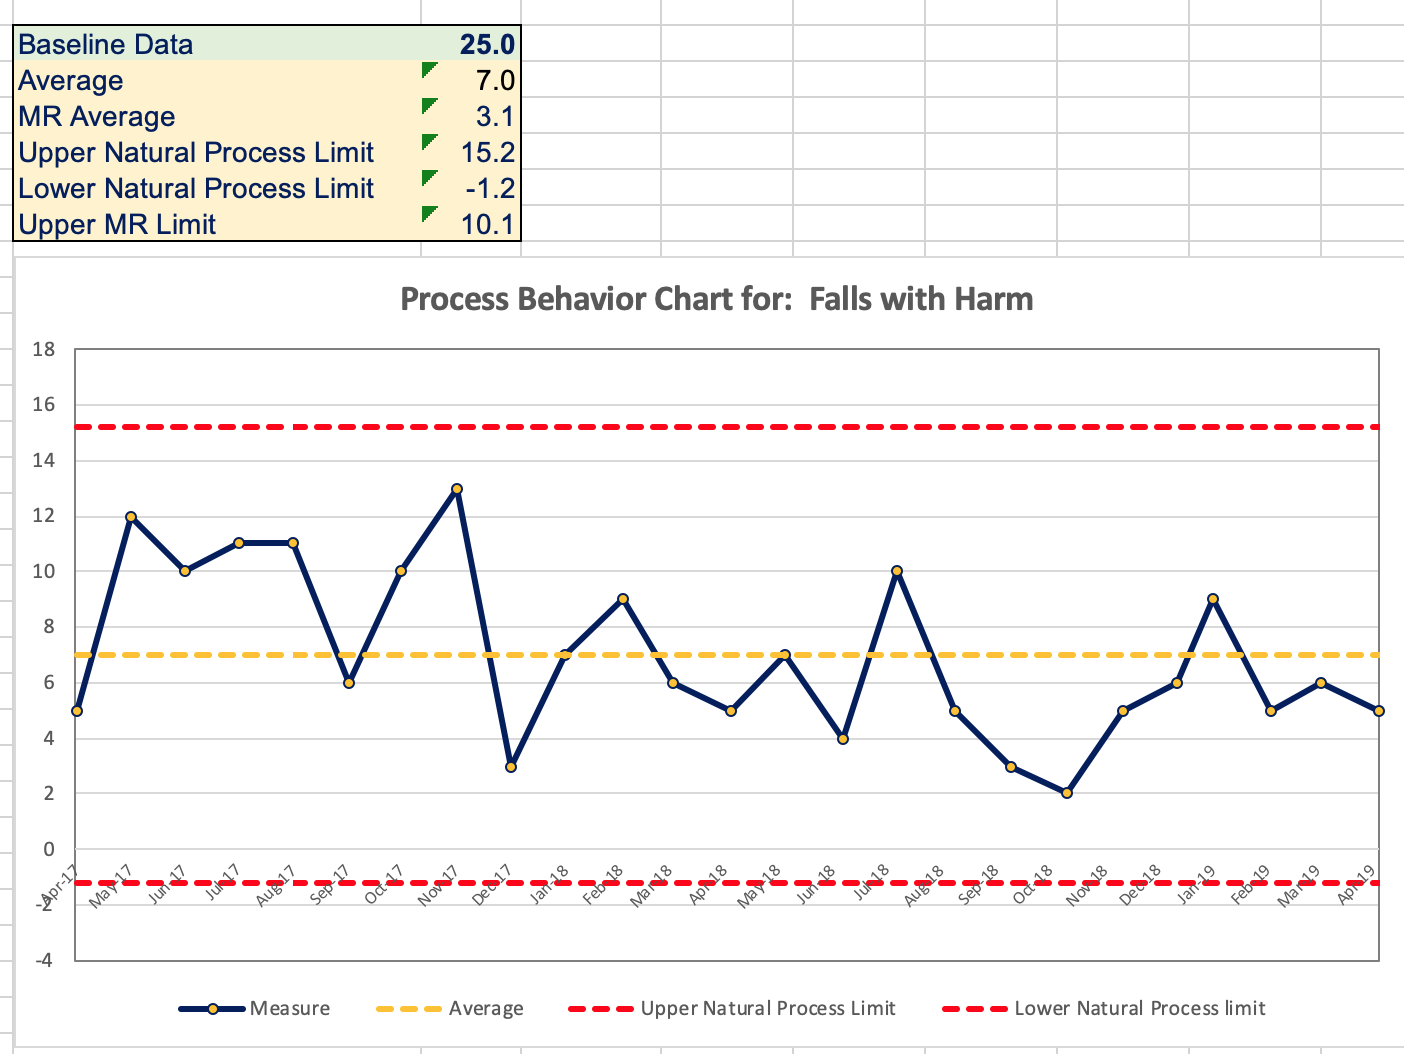 The overall average is lower when we use all 25 data points for the baseline… about 7 (the same as the goal).
The lower limit is calculated to be negative… so this now suggests that a month with zero falls is possible (if not unlikely) in the current predictable system.
Using 25 data points instead of 12 provides limits that are a bit more accurate… but the high level voice of the process is the same.
In either scenario, there is one Moving Range value that’s just near the Upper Range Limit:
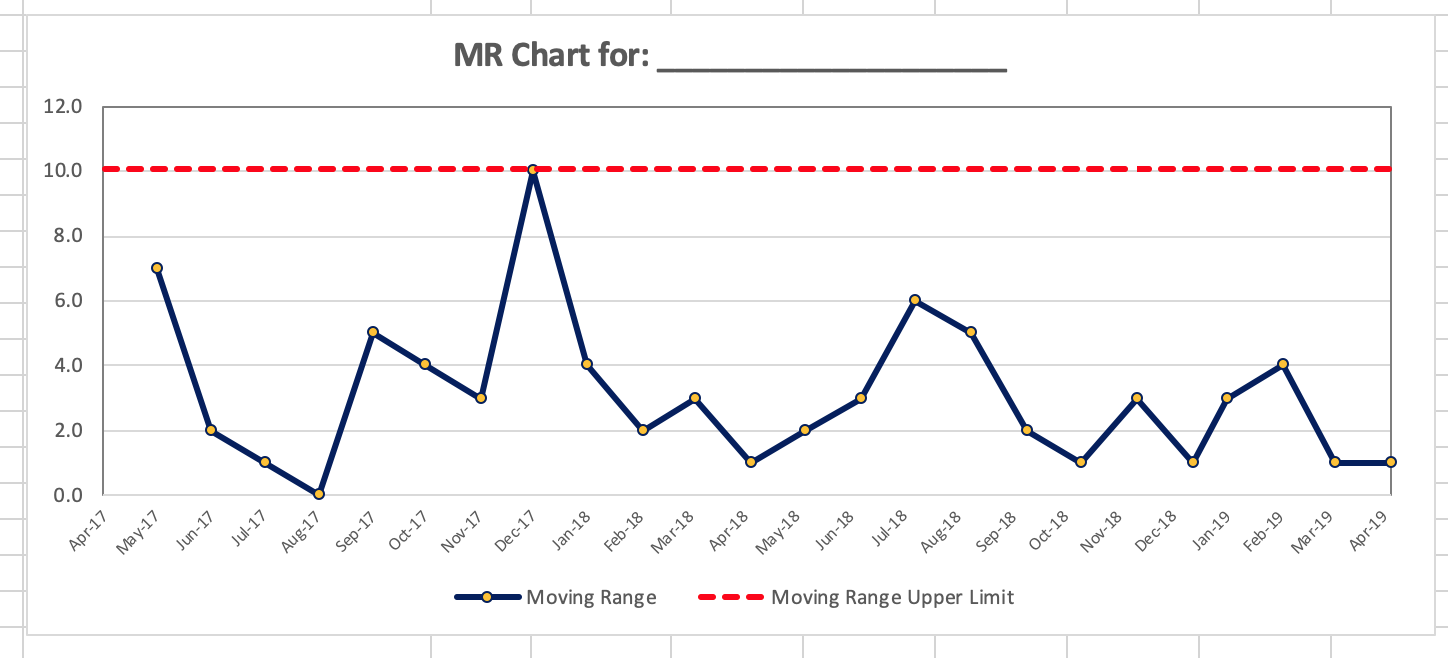
That corresponds with a month-to-month drop from 13 falls to 3 falls. In the 25-data-point baseline, that one MR point is 10.1 and the Upper Range Limit is exactly 10.1.
If there’s ANY point there worth investigating, it might worth looking for a different in the system and work processes from November 2017 to December 2017, but I wouldn’t expect to find any “special cause” — especially with that being so far in the past. That jump from 13 to 3 probably represents the limit of how much month-to-month variation we’d expect to see with the random fluctuation in that predictable system.